In January, May and October the monthly letter is replaced by a Kvartalsvis fokus that identifies one or more themes currently on my radar. It is somewhat longer; there are charts. I rely on your patience.
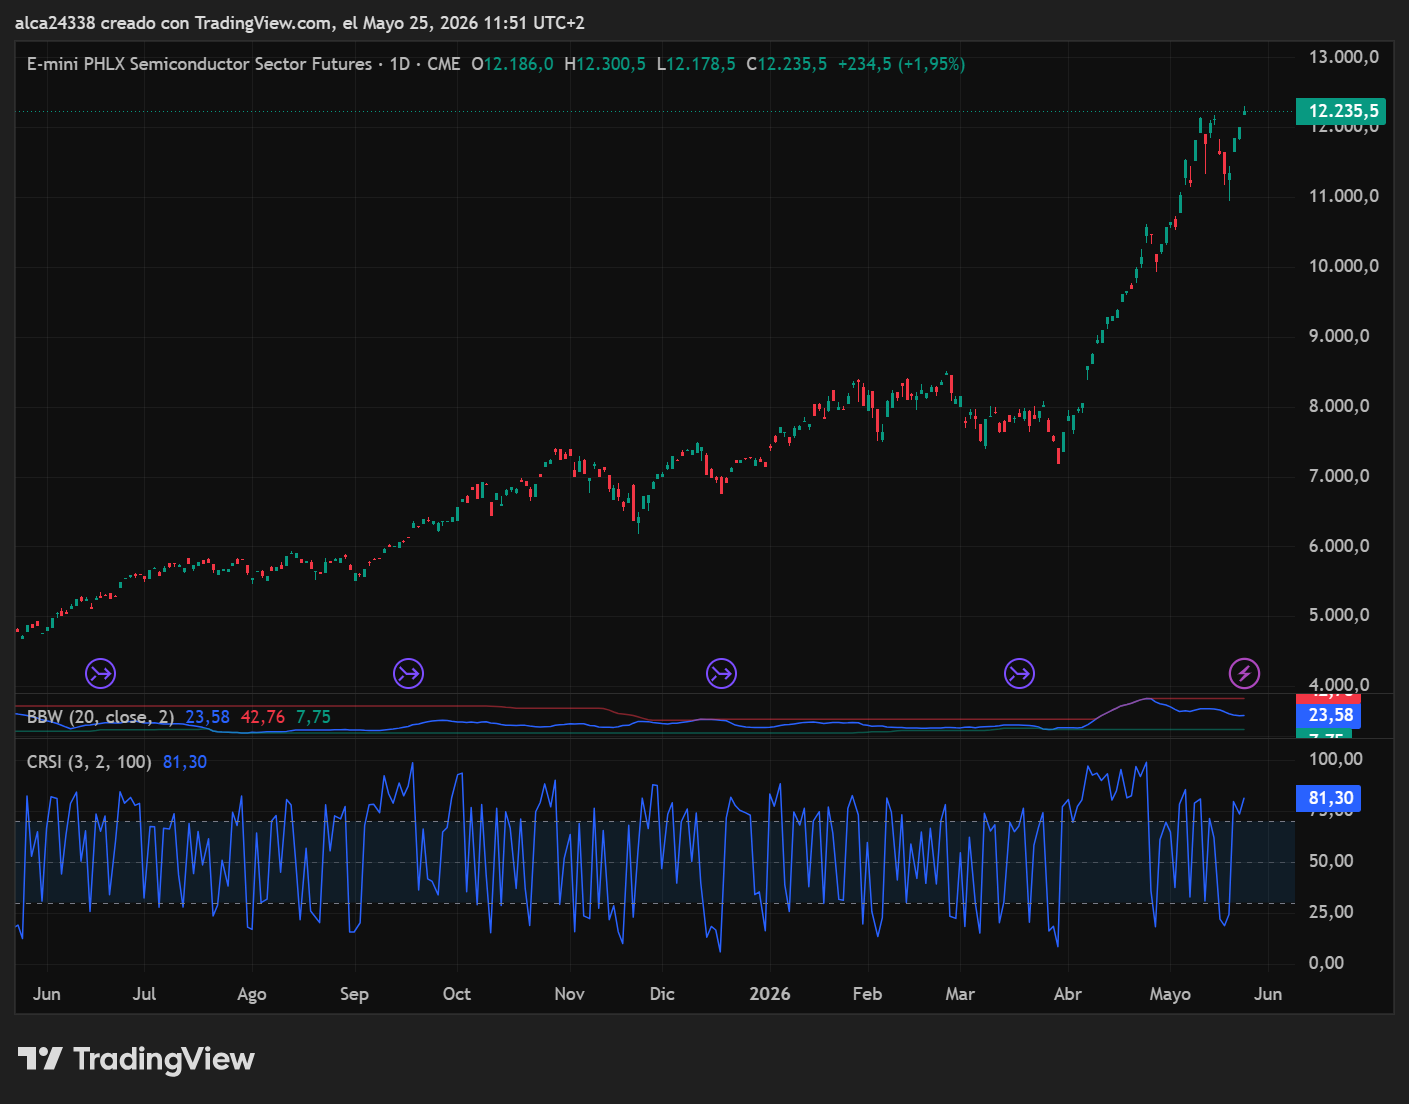
The equity rally that began from the late April 2025 lows has been driven by the AI theme — and semiconductors in particular.
The SOX (Philadelphia Semiconductors Index) has tripled in value in one year.
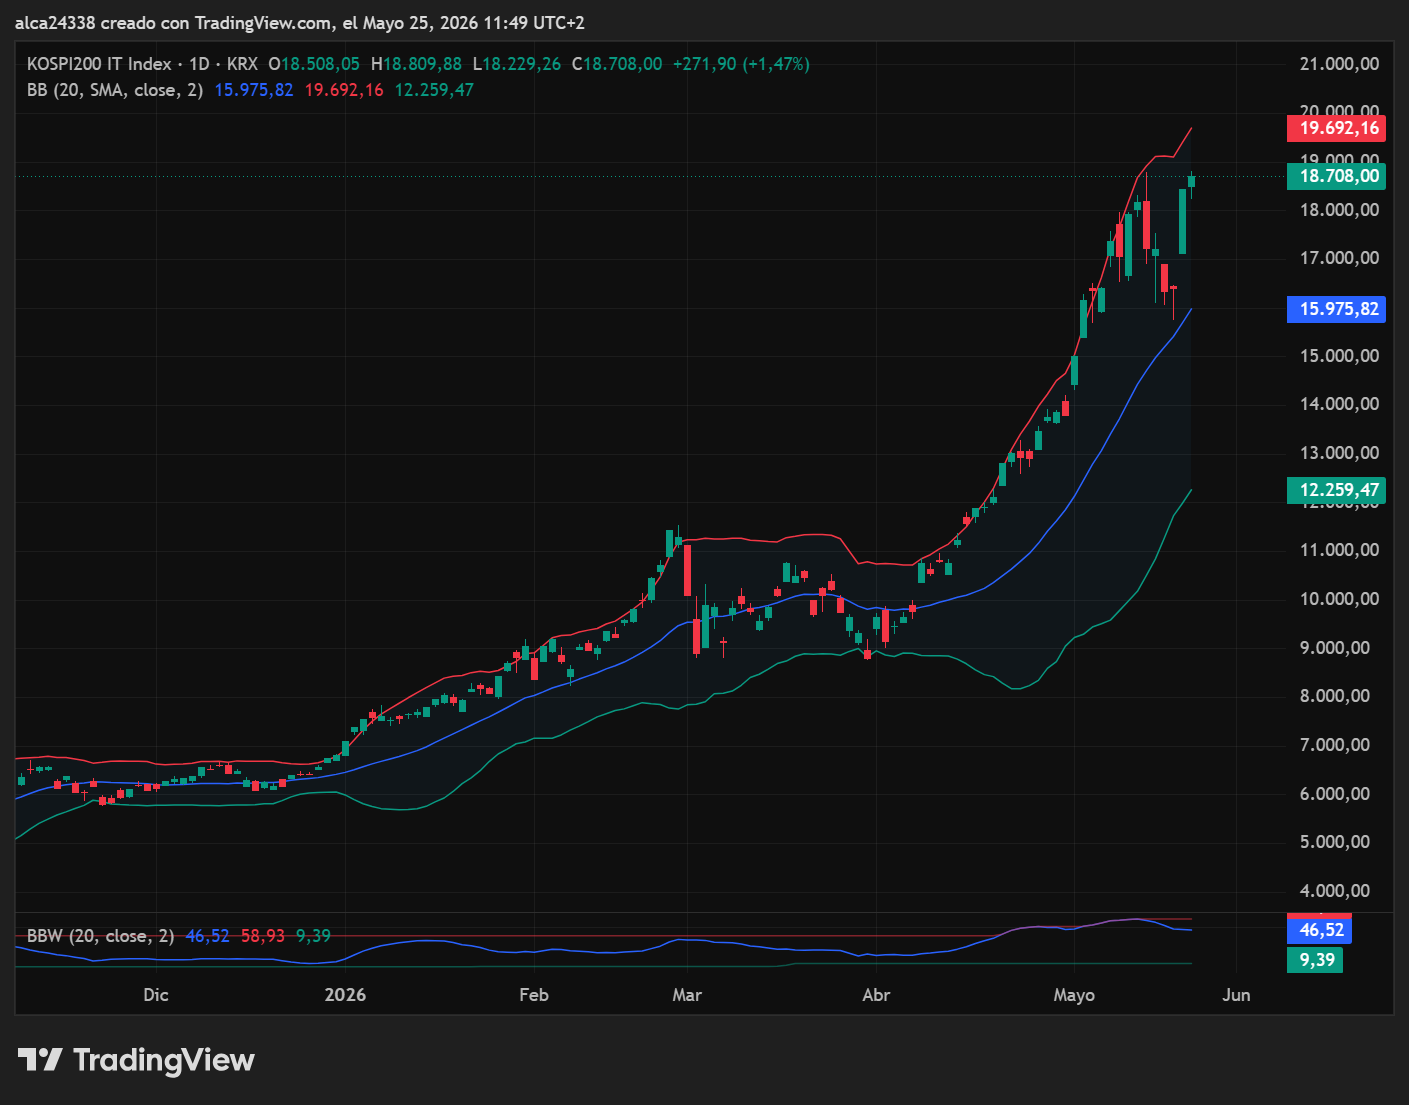
The national index most aligned with the SOX is the Korean KOSPI200. It too has tripled in value in one year.
South Korea's three major insurance companies have reported that around 16% of policyholders liquidated their pension funds to invest in equities in the first quarter of 2026.
An enormous figure.
Normally, pension fund redemptions did not exceed 3% per year.
These behaviours are cyclical and repeat themselves in all exponential and final phases of a bubble.
Those with longer memories will recall the year 2000: ordinary people selling homes and businesses just to take part in the Dotcom madness.
Let us unlock a memory: between 1999 and 2000, Silicon Valley's mantra was «Get big fast» — sacrifice profits on the altar of brand awareness.
In January 2000, Pets.com bought a 30-second advertising slot during Super Bowl XXXIV, spending over two million dollars to launch its mascot — a sock puppet dog.
The spot was an extraordinary cultural success: the mascot even appeared in the Macy's parade.
Yet between February and September 1999, the company had already spent $70 million on marketing against revenues of just $619,000.
Meanwhile, in a garage in Seattle, a young Jeff Bezos was puzzling over how to sell books online, trying to spend less than the (little) he was taking in.
In March 2000 the dot-com bubble burst. In November of that same year, nine months after the Super Bowl, Pets.com filed for bankruptcy and disappeared.
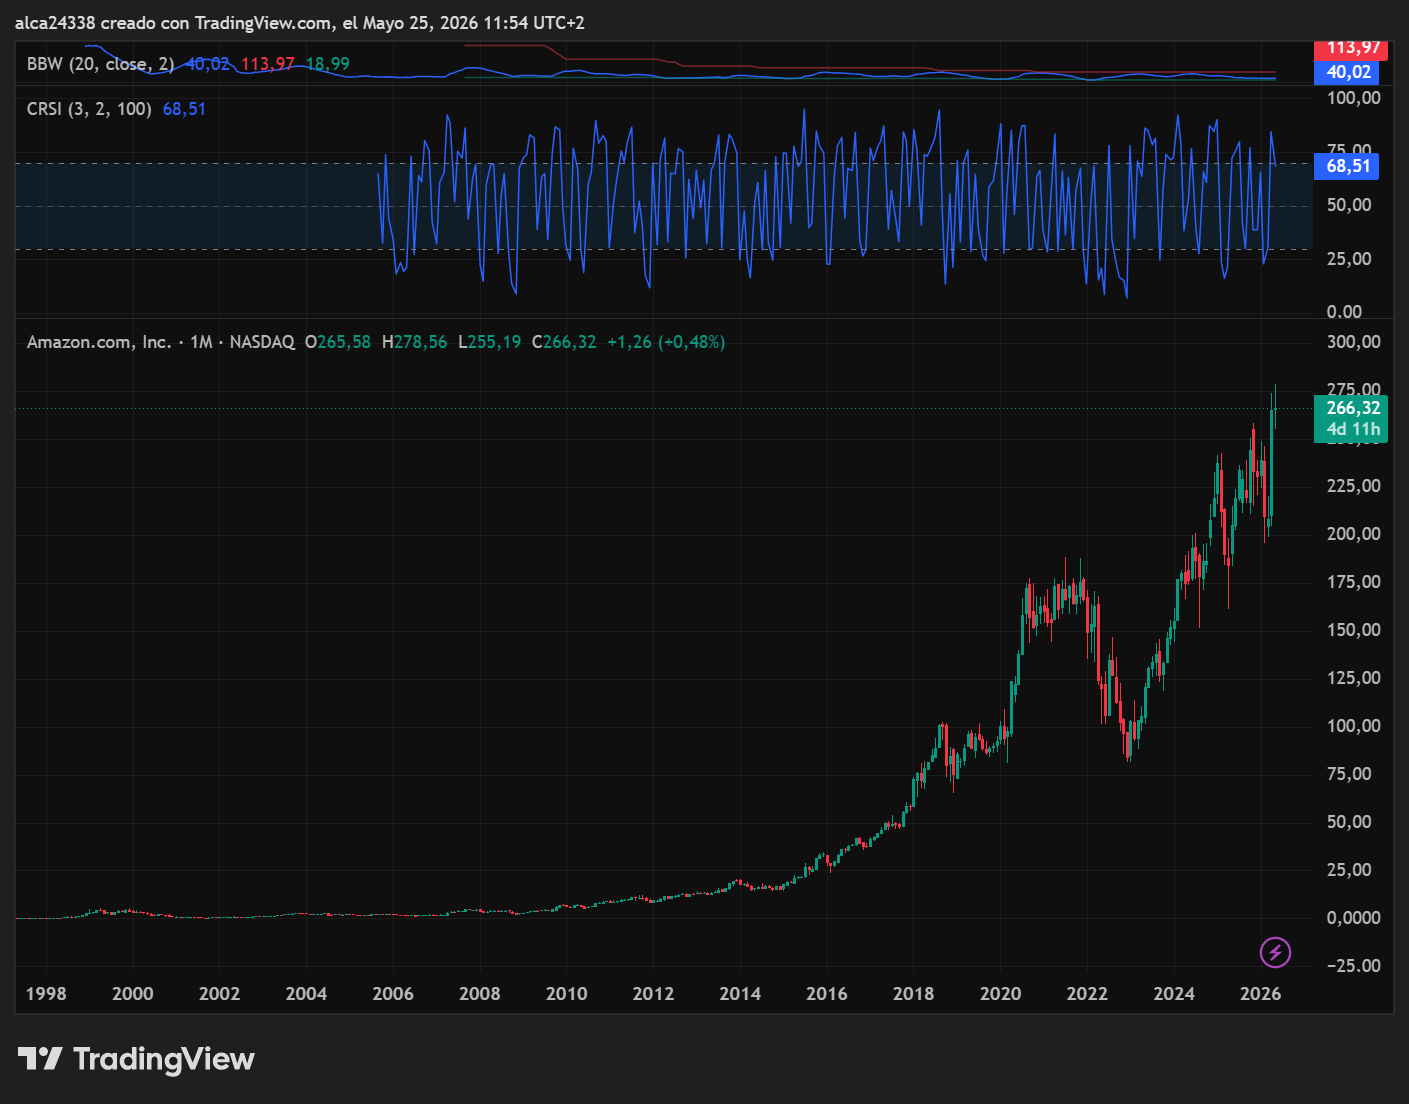
Amazon is still here. Since that November 2000 it has multiplied its value by 270 — anyone who invested $10,000 on November 30, 2000 would today have $2,700,000.
Since I have been in markets, at least a couple of times a year someone appears predicting a new 1929.
They may not even believe it themselves.
Prophets of doom sell better than those who limit themselves to an analysis of the facts.
Predicting catastrophe makes an audience; trying to listen to the market's breath does not.
And many predict an apocalypse when the AI bubble bursts.
As in every technological leap, the challenges are real.
OpenAI has a debt situation that is difficult to sustain in the medium term.
Or rather: OpenAI finds itself in a paradoxical financial position.
The company is almost free of direct long-term debt, but has accumulated commercial spending commitments of over $1.4 trillion in infrastructure and cloud for the coming years.
To finance its enormous computing needs without taking on debt directly, Altman's company has shifted the risk onto logistics partners — SoftBank, Oracle and CoreWeave — which have taken on around $100 billion in debt to build the data centres dedicated to it.
Despite revenues around $20 billion, OpenAI burns cash constantly and expects losses of $14 billion.
For this reason it relies continuously on massive private investment rounds to avoid running out of liquidity.
This is the classic case of trying to grow into something too big to fail.
Sometimes it works — we have discussed Tether many times, and its vast murky areas concealed by its even larger capitalisation.
Sometimes it does not. And then things get painful.
OpenAI's IPO is announced for September. It will be interesting to follow.
On the other side, there are companies like Anthropic which — regardless of ethical and political considerations that are not relevant here — have all the characteristics needed to survive any crisis and perhaps even to lead the next one.
There is also an ecosystem developing.
Copper miners, nuclear energy.
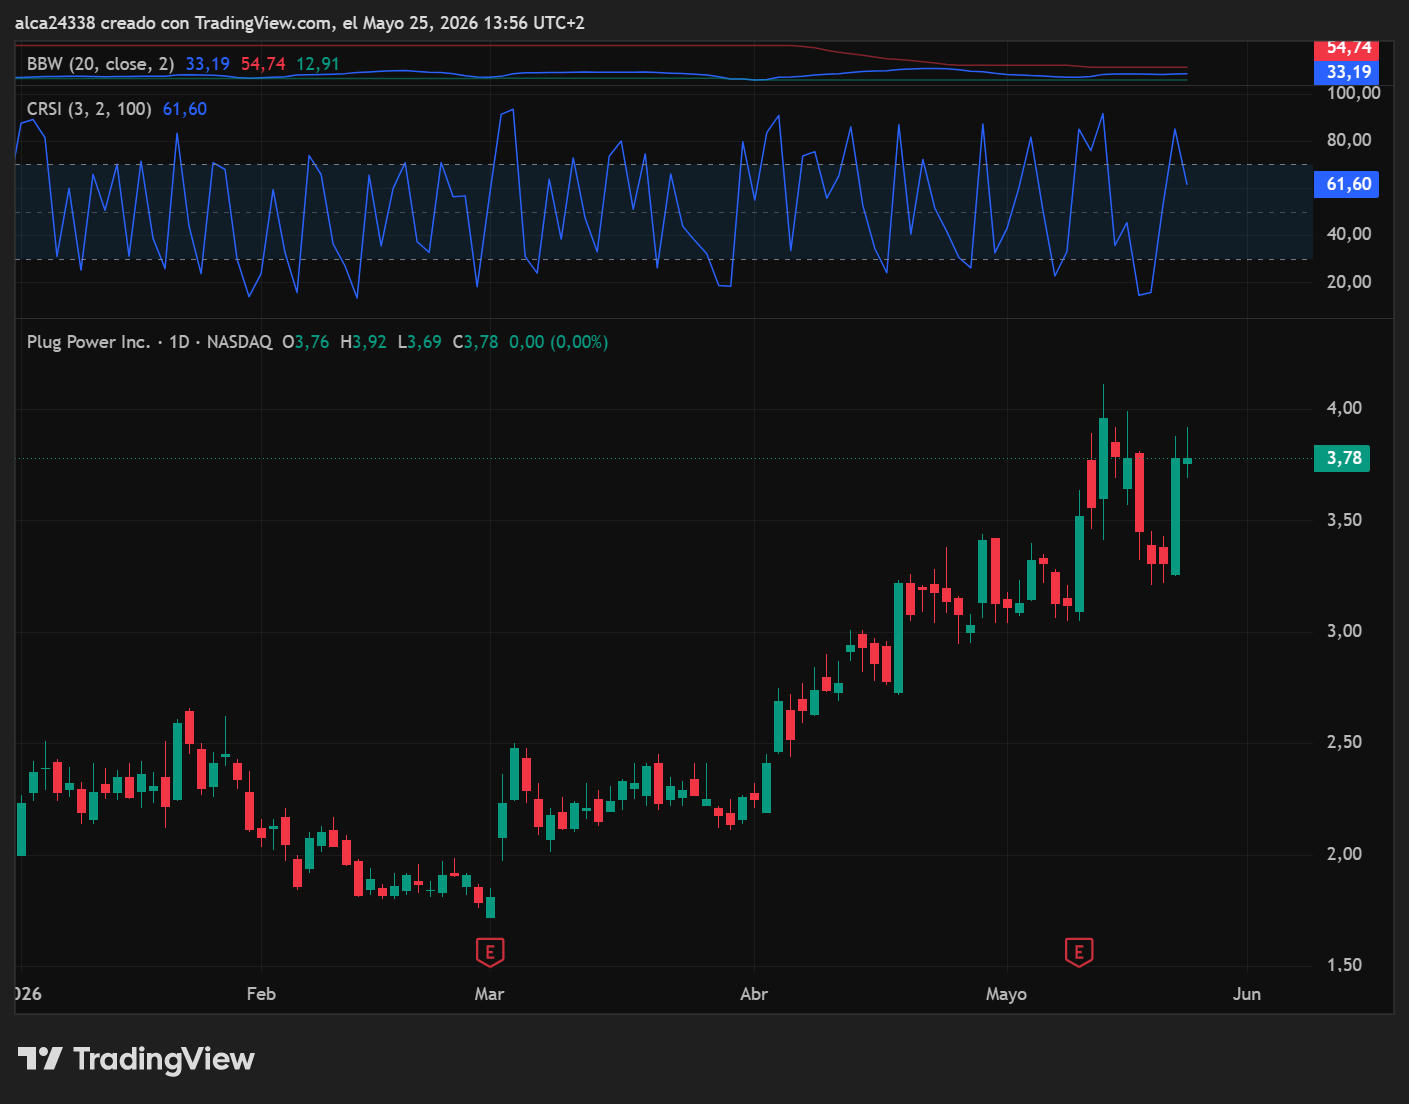
Old favourites of mine like Plug Power, which seem to signal a returning interest in hydrogen.
The key point is clear: as it stands, AI consumes a quantity of resources — energy above all, but not only — that is unsustainable in the medium term.
The challenge is to find ways of limiting its energy impact.
Various projects are developing in this direction: I am thinking of Kairos Power and the agreement between Microsoft and Constellation.
I am also thinking of neuromorphic chips, capable of reducing consumption peaks by more than 80% compared to a standard GPU.
This is where the real contest will be played out, in my view.
The AI bubble will burst, like all the others, because that is what bubbles do: they burst.
But bubbles do not always cancel an entire sector when they burst.
Sometimes the burst is merely a rebalancing of excesses and a redistribution of power — a return to the mean, as those who speak well like to say (not my case).
Exactly what happened with the Dot-coms.
And what will happen with AI.
Which is here to stay: better to make peace with that.
The University of Michigan's Consumer Sentiment Index registered an all-time historical low in its latest May preliminary reading, at 48.2 points.
This figure must be read against the backdrop of the all-time equity highs discussed above.
The 48.2 reading in May represents the lowest level ever recorded since the University of Michigan's series began in 1952.
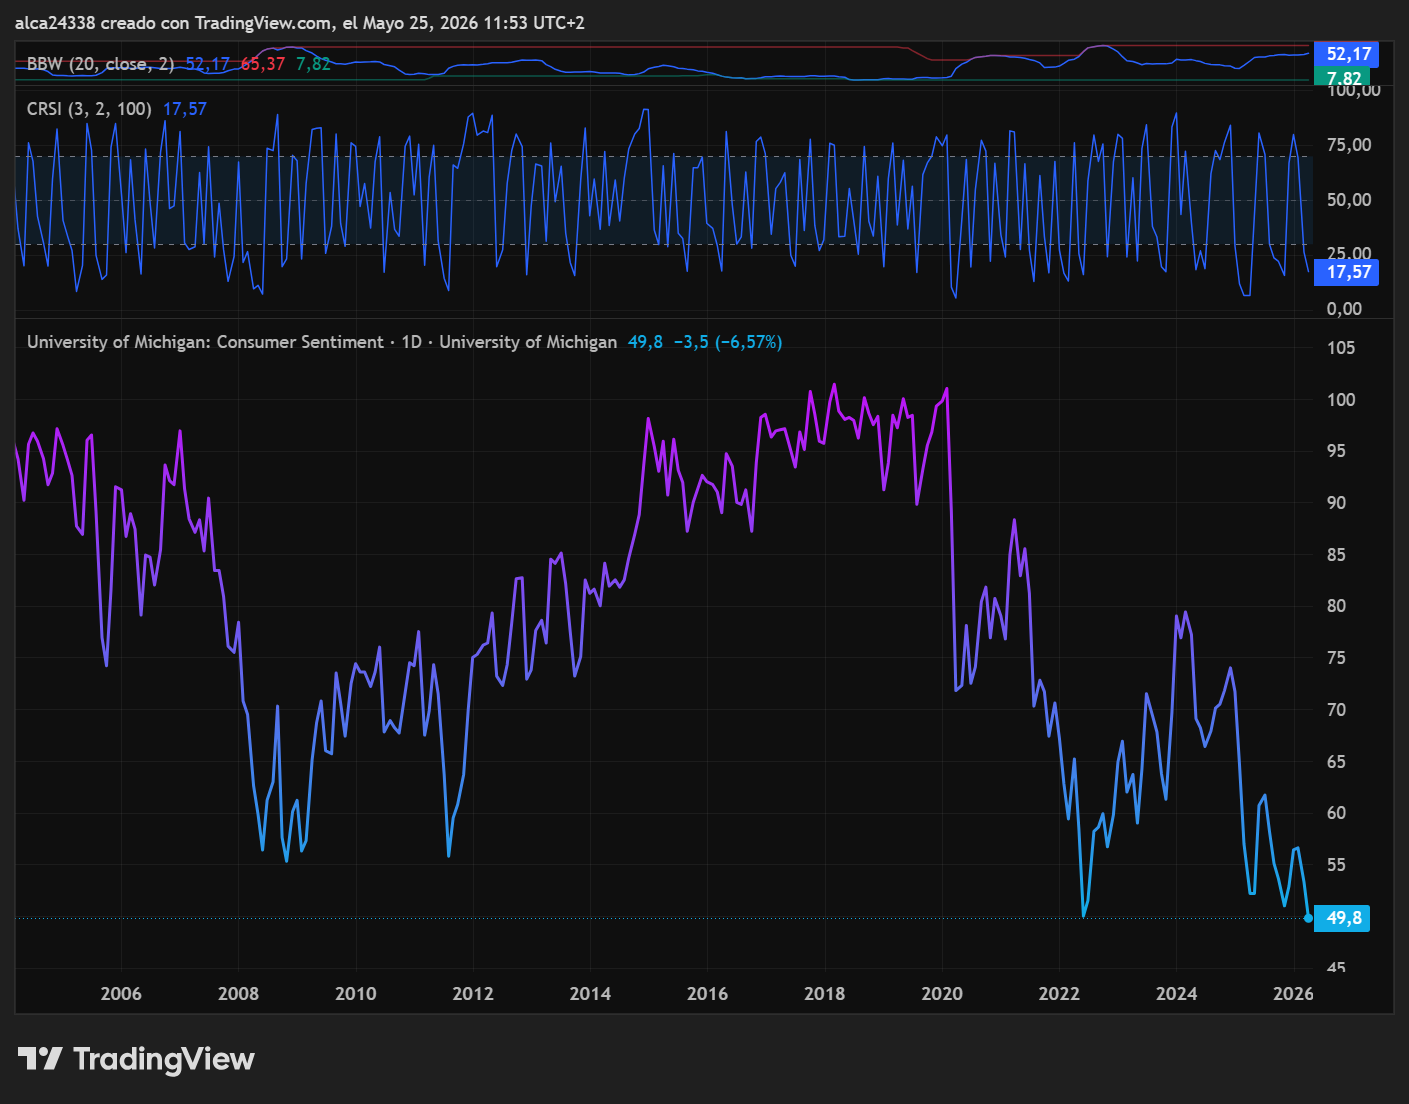
The current reading is even below the historical lows reached during the 2008 financial crisis — whose negative peak was 55.3 in November 2008 — and is also below the levels seen during the inflationary shocks of the early 1980s and the Covid-19 lockdowns.
Classical economic theory holds that low consumer confidence leads to recession and equity falls.
It is a topos found in every basic economics textbook.
There is a logic to it: if the consumer is depressed and stops spending, the economy stagnates and with it the market.
I have no intention of arguing against this.
I would, however, venture an alternative view that I hope will not seem excessively conceptual.
If equity markets are at all-time highs, reflationary pressures are significantly on the rise, and bonds are falling — all while consumer confidence sits at 74-year lows — what would happen if confidence returned toward its historical average?
En fascinerende kamp: forbrukertillit mot markedstrend.
K-Wave Summer. Reflation.
As I have said many times in previous letters, in October 2022 I believe the transition from Spring to Summer of the Kondratiev cycle began. Until the markets signal that I have taken a wrong course, this will be my map.
For those interested in exploring what I describe below, I recommend the wonderful book Inventing Money by N. Dunbar, published in 1999 by Wiley, which tells the story of the birth, triumph and shipwreck of Long-Term Capital Management.
In 1994, Long-Term Capital Management was founded by John Meriwether alongside Nobel laureates Robert Merton and Myron Scholes.
The fund achieved extraordinary returns through bond arbitrage and derivatives with enormous leverage.
The strategy rested on the assumption that spreads between similar instruments would revert to normal.
After the Russian default of October 1998, correlations broke down, spreads exploded and LTCM lost nearly all its capital within weeks.
The fund was aimed at large financial institutions and government entities.
Its failure triggered a violent but short-lived systemic crisis.
After falling more than 30% in a few weeks, the S&P 500 quickly recovered all lost ground, closed the year at highs and laid the foundations for the exponential 1999 rally that carried markets to the absolute peaks of March 2000.
1998 was the fourth and final year of the US Presidential Cycle — running from the last full year of the outgoing president to the subsequent mid-term elections — and also the seventh and final year of the Composite Septennial Cycle.
An intersection that occurs every 28 years.
Add 28 to 1998…
In years when these two cycles intersect, events of geopolitical or financial significance tend to occur, with important market implications:
1858: following the collapse in grain prices and the failure of four of the major American railway companies between 1857 and 1858, a wave of bank insolvencies swept North America and England, crippling entire regions of both countries.
1886: the year of the second American industrial revolution, a US stock market boom. The world's largest gold deposit was discovered in the Northern Transvaal; the enormous quantity of gold released onto the market definitively consolidated the Gold Standard.
1914: outbreak of the Great War, global financial panic, the secular low of the Dow Jones that laid the foundations for the great 1915 rebound.
1942: the effective entry of the USA into the Second World War, beginning of the great War's Bull Market.
1970: culmination of racial tensions across the USA, beginning of the dismantling of the Bretton Woods system.
We have already discussed 1998.
I am confident you have done the arithmetic correctly. You will find that 2026 is the year of the intersection between the end of the Presidential Cycle and the Composite Septennial.
A characteristic common to all the years considered above is that each carried within it a more or less violent stress event, followed by a rally in equity markets in the subsequent year or two.
Between May 26 and November 9, there are three cluster points on the weekly cycles that could lead to a significant equity correction.
Statistics, of course. Not certainty.
The geopolitical issues on the table are many. The potential systemic triggers too.
When Russia invaded Ukraine in February 2022, Kyiv's industrial capacity for building attack drones was infinitesimal.
In 2023 the first Ukrainian drone strikes began — few, short-range, more demonstrative than strategic. By 2024 the strikes had become medium-range, targeting strategic installations in Russia's energy supply chain.
In October of that year, Putin updated Russia's nuclear protocol, declaring that Moscow would be justified in using tactical nuclear weapons in the event of attacks on the Russian population.
On Sunday May 17, a highly detailed WSJ article described a series of Ukrainian strikes on the urban area of the Russian capital, reportedly causing three deaths, dozens of injuries and damage to various infrastructure.
The same article discussed the exponential growth of Kyiv's industrial capacity — which now not only commands large drone numbers for its own use but is also exporting them to the Gulf region.
Discontent is growing in Russia, and strikes at the heart of the capital could back Putin into a corner.
Aldri klem en rotte i krok.
The only hope comes from the RTS Index. The Moscow index is flirting with the 1,200 area, which has repelled every upside breakout attempt since 2022. This time it appears to approach it with more momentum.
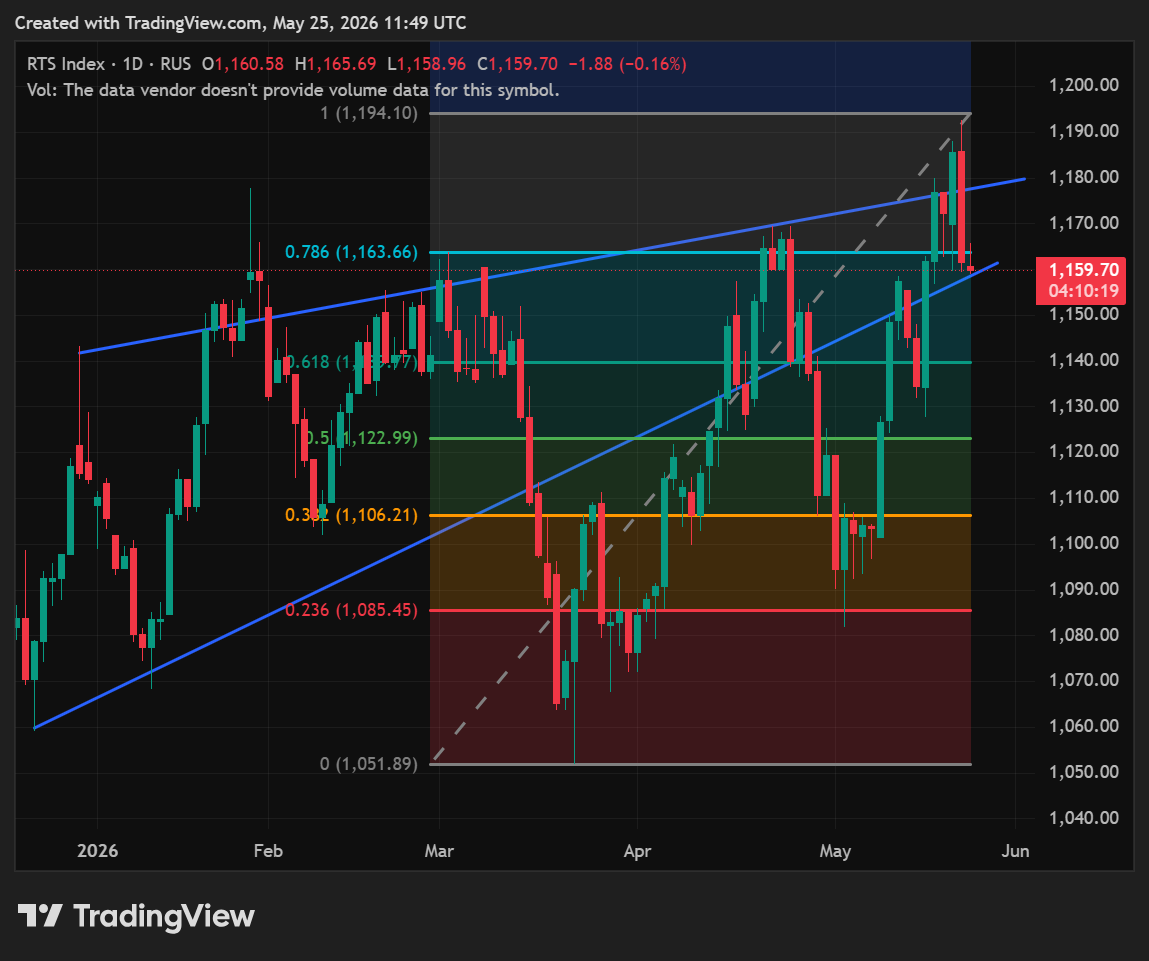
An upside breakout could signal a possible turning point in the conflict.
Neither side will ever admit defeat.
But a freezing of the status quo and an open-ended ceasefire could give both sides the ability to sell the outcome domestically as a victory, and bring the oligarch to more moderate counsel.
Trump har satt seg fast i Iran. Israel vil ikke lett akseptere et amerikansk tilbaketrekk som ikke er mer enn fasade. Mellomvalget nærmer seg raskt og populariteten til det dynamiske duoen ved roret i Det hvite hus er i fritt fall. Kilder nær administrasjonen rapporterte 17. mai at Cuba angivelig hadde kjøpt «more than 300 military drones» og diskuterte om de skulle brukes mot Guantanamo.
Åpenbart tror ingen det.
Det spiller ingen rolle.
Annekteringen av Cuba, formell eller ikke, som den 51. staten kan godt komme tilbake på moten før 3. november.
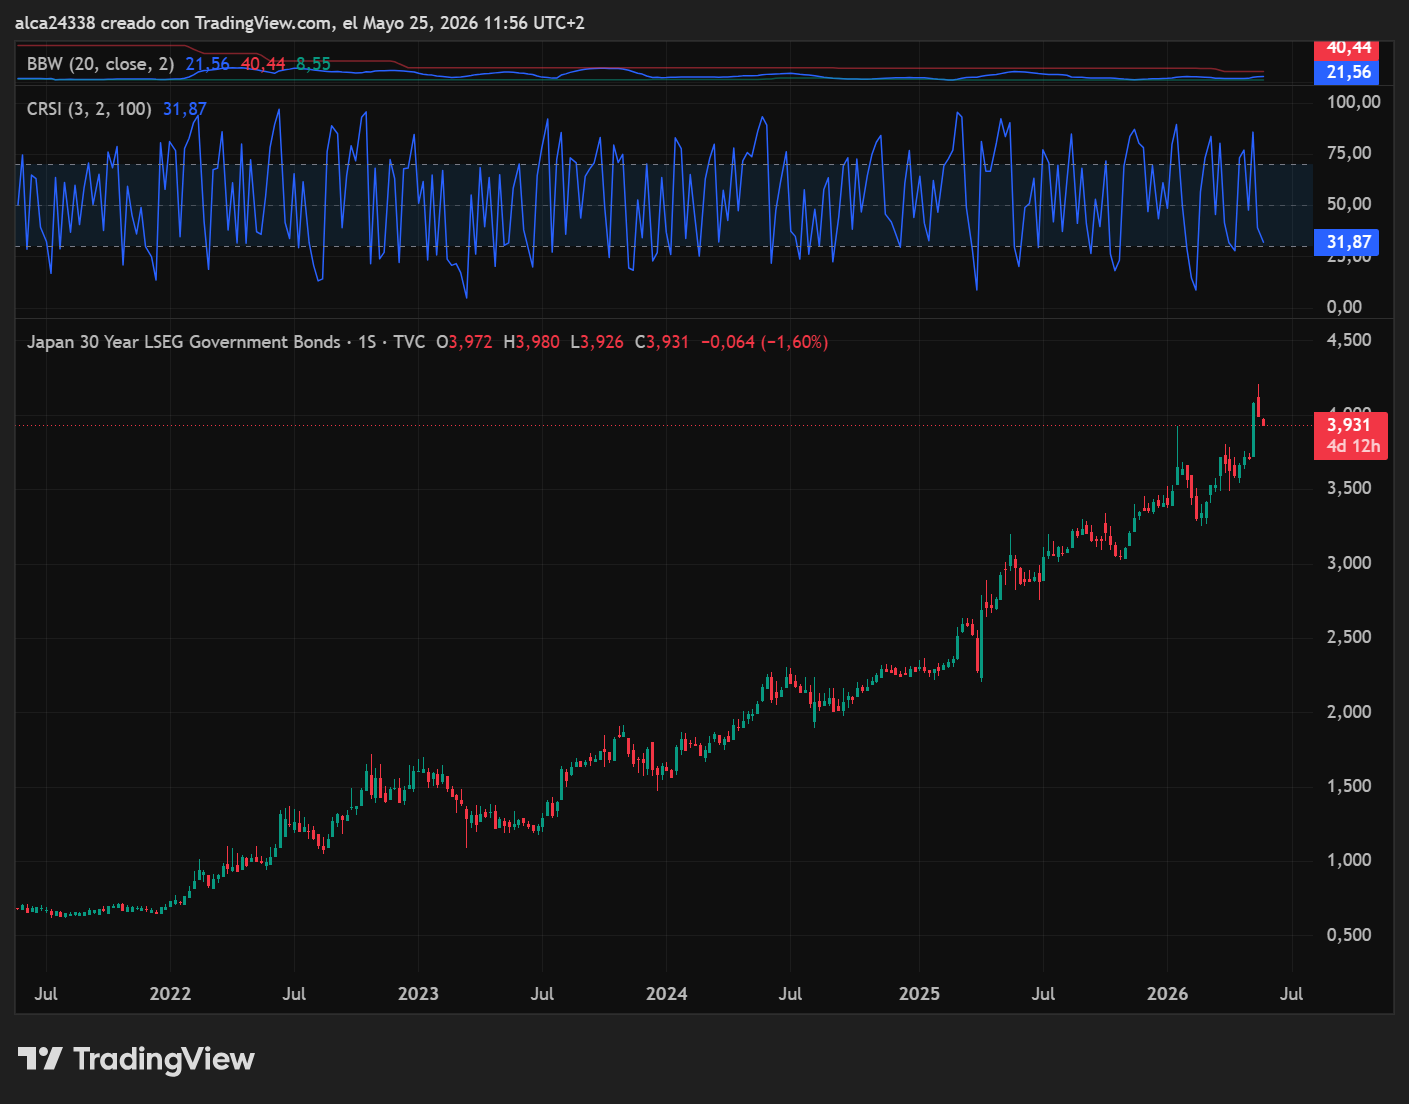
In the night of Monday May 18, the Japanese 30-year bond reached the highest yield of this century, touching 4.2%.
At that same moment, the US equivalent — the 30-year T-Note — was yielding 5.088%.
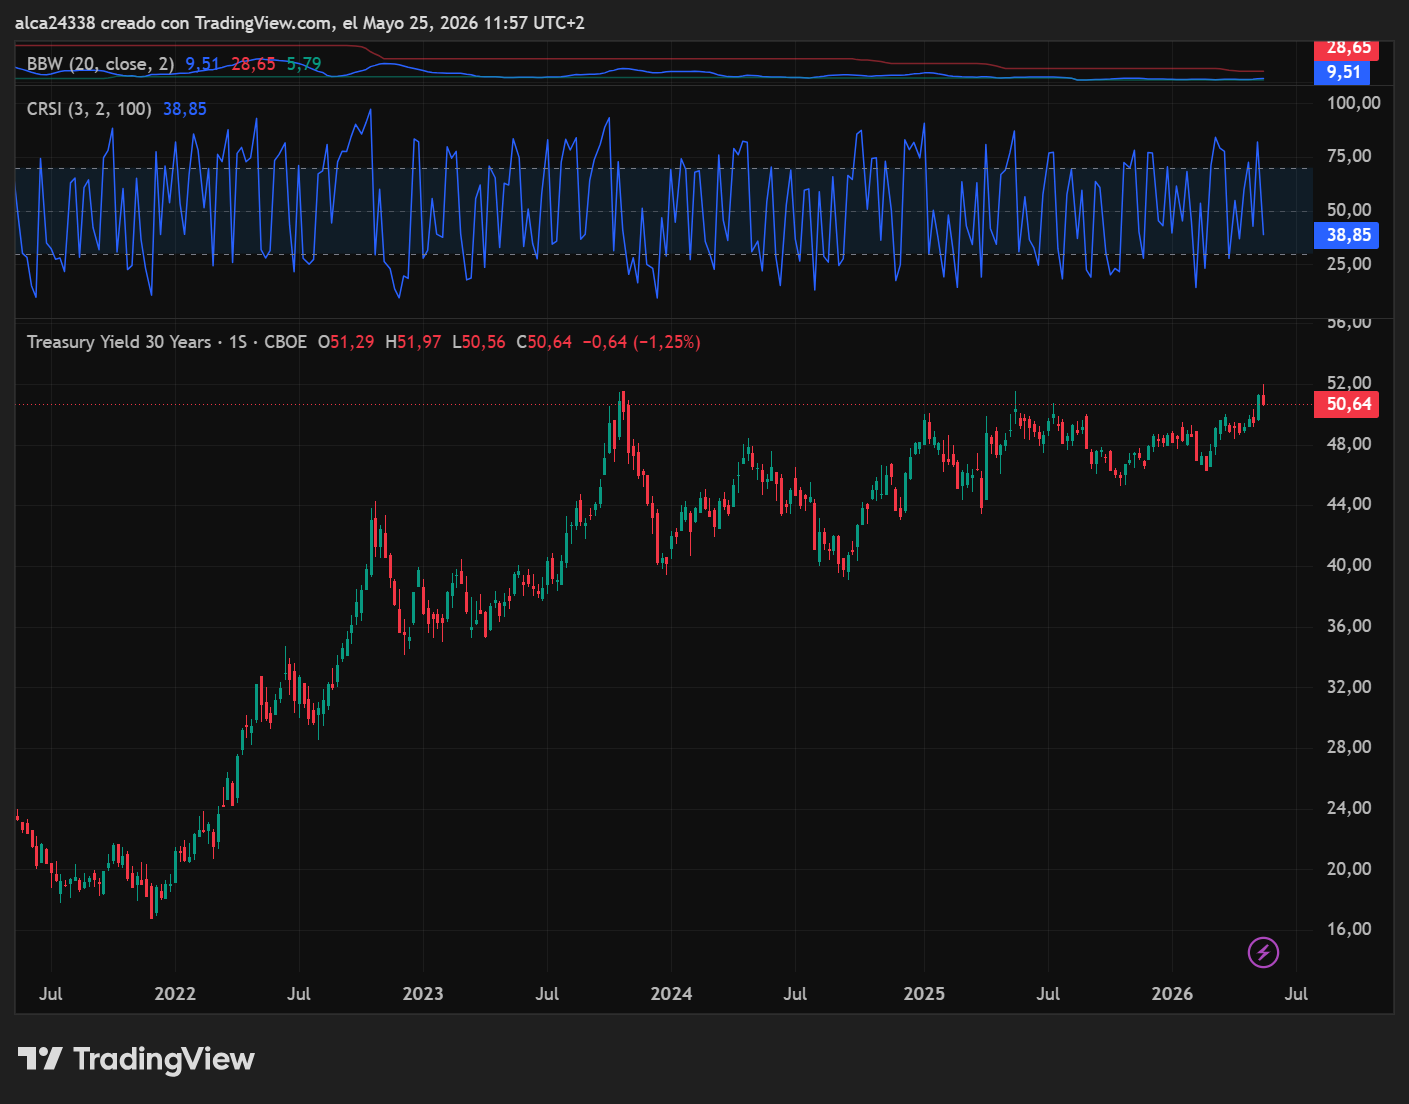
For the first time, the delta between Japanese and US 30-year rates has fallen below 1%. On average, from the mid-1990s to today, it has been above 3% and has very rarely dropped below 2%.
The Japanese — and more broadly the Asians who historically reference the yen — are among the largest holders of US public debt.
The yen-to-USD carry trade, which made sense when the yield differential was high, now makes far less sense at below 1%.
Dette er ikke en kanariefugl i gruven. Det er en fasan, eller en gribb, eller hvilken stor fugl du enn måtte forestille deg.
Naturally, the central banks — the Fed, BOJ and BOE above all — are fully aware and will act to neutralise the threat.
The ECB, meanwhile, will watch from the sidelines. European long-dated bonds are now, for perhaps the first time ever, yielding below their Japanese equivalents.
Much of the ECB's decision-making power traces back to the Bundesbank, which — however bizarre it may seem at a century's remove — has as its primary mandate the prevention of a new Weimar.
Returning to non-EU central banks: they often succeed in their aims.
Sometimes, though, things get out of hand.
There is one indicator I will be watching closely in the coming months: the USD/JPY exchange rate.
For now it is quiet around 160.
Under 145 blir fasanen i gruven en gribb.
Under 140 blir gribben en pterodaktyl.
And in that case I might change my approach to equities.
As long as the yen/USD cross remains at current levels this is merely a warning and nothing more. And my strategy will not change: I will buy equities in the event of corrections in the second half of the year.
As always, volatility analysis will govern the entry timing.
In my previous report I anticipated a VIX remaining compressed between 15 and 25 points.
That proved to be the case, creating a favourable environment for the short strategy set up for May. Good.
For June the overall structure does not change, but I would expect volatility to increase progressively. A compact must be made with the market: rising daily premiums are matched by compressed monthly premiums.
An environment favourable to a long monthly straddle combined with two short 3-day strangles per week. Naturally, careful attention must be paid to strike selection and changes in skew.
More details in the weekly report dedicated to options trading.
As communicated in real time, on May 25 I carried out a number of exit and entry operations.
Sales: I exited the long RTY position, locking in 39% on the trade. I remain long only on the FTMIB, which continues to show truly impressive relative strength. I closed the Bitcoin vs Ethereum spread as it was going nowhere; the 3.7% return on the position was negligible, but I wanted to free up liquidity to prepare new operations that may present themselves in the second half of the year.
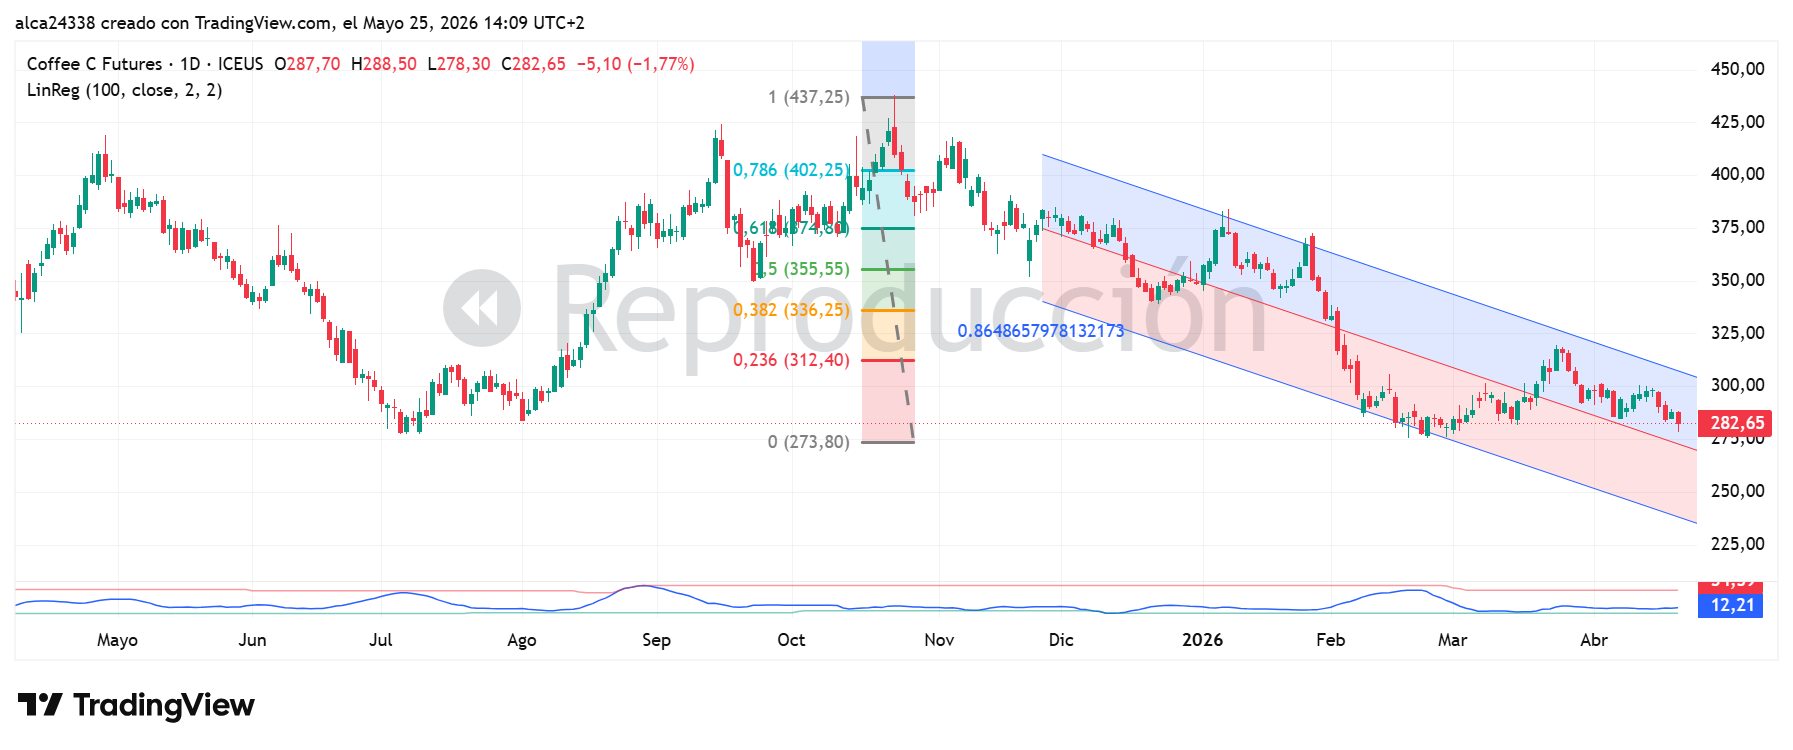
Purchases: on May 18, I bought 5% in coffee at $264.50. This is a position I would like to build on weakness and hold for a long time.
| Posisjon | Vekt | Åpnet | Inngang | Current | P&L % | Notater | |
|---|---|---|---|---|---|---|---|
| Long WEAT | 5% | 18.11.2025 | 549.05 | 647.38 | +18.2% | ||
| } | Long KC Coffee | 5% | 18.05.2026 | 264.50 | 272.00 | +2.8% | |
| Long FTMIB | 10% | 10.04.2025 | 34,275 | 47,890 | +39.7% | ||
| Kontanter | 80% | — | — | — | — |
In the first week of May I had at least two opportunities to add to my wheat (WEAT) position and did not take them. I may have other chances, but for operational clarity: when the opportunity to enter is there, take it — it frees attention from one market and lets you concentrate on others.
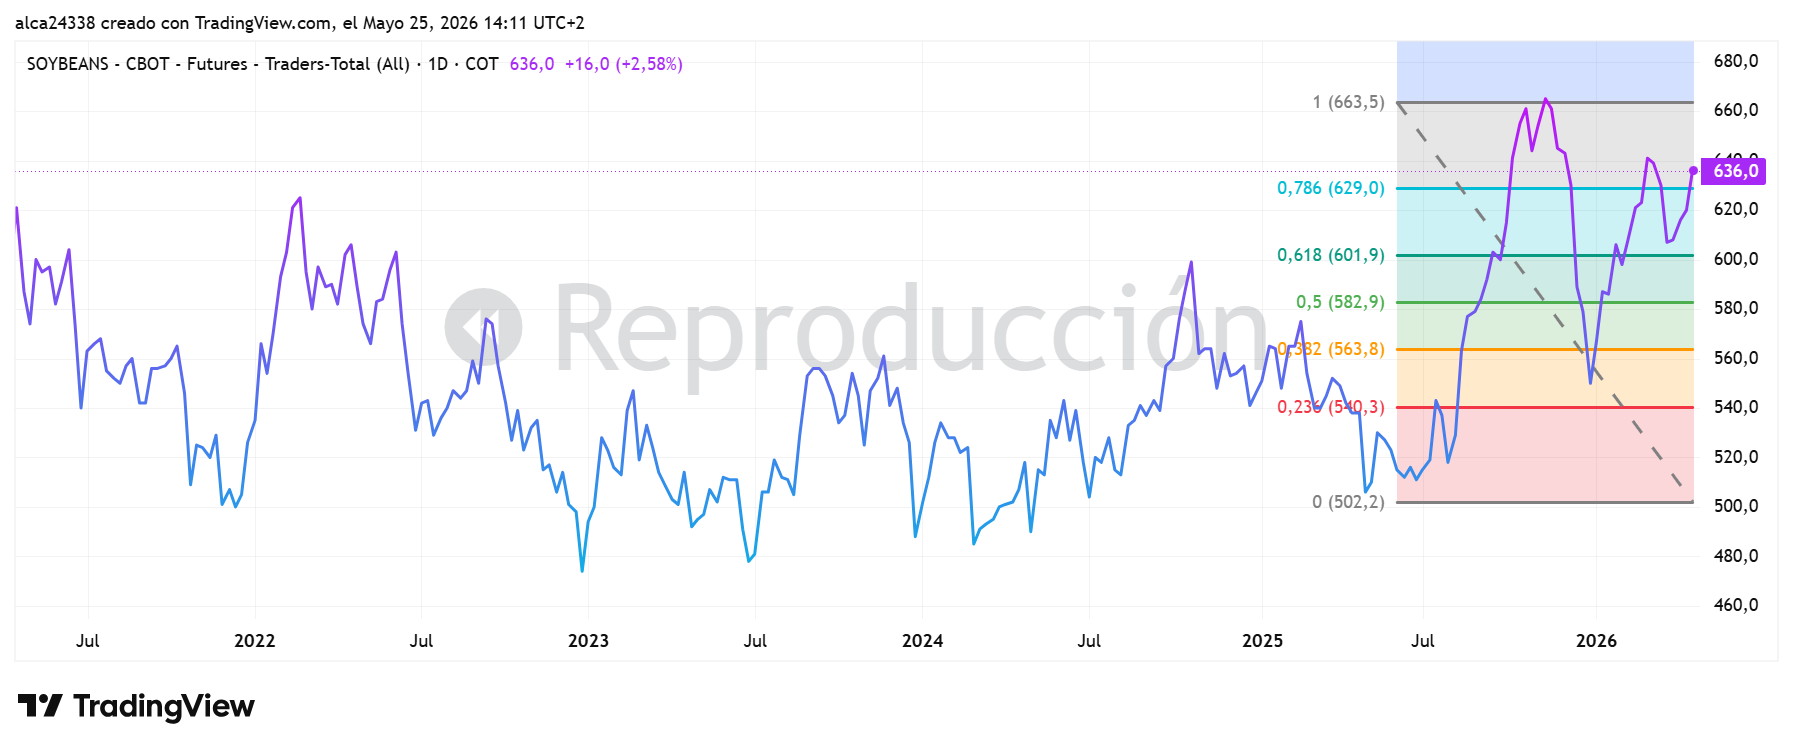
I continue to monitor soybeans — see the end-of-April letter.
KC Coffee has a very mixed setup. In the short term it looks poised to correct, with room for a 10–15% decline. Over the longer term, however, it appears to be reloading.
I will update in real time, as always, on any operations that change my portfolio.
«Ingen er mitt navn — Ingen kaller de meg, far og mor og alle mine feller» — Homer, Odysseen, IX